Portfolio Explorer
Transforming complex building and urban data into interactive spatial experiences.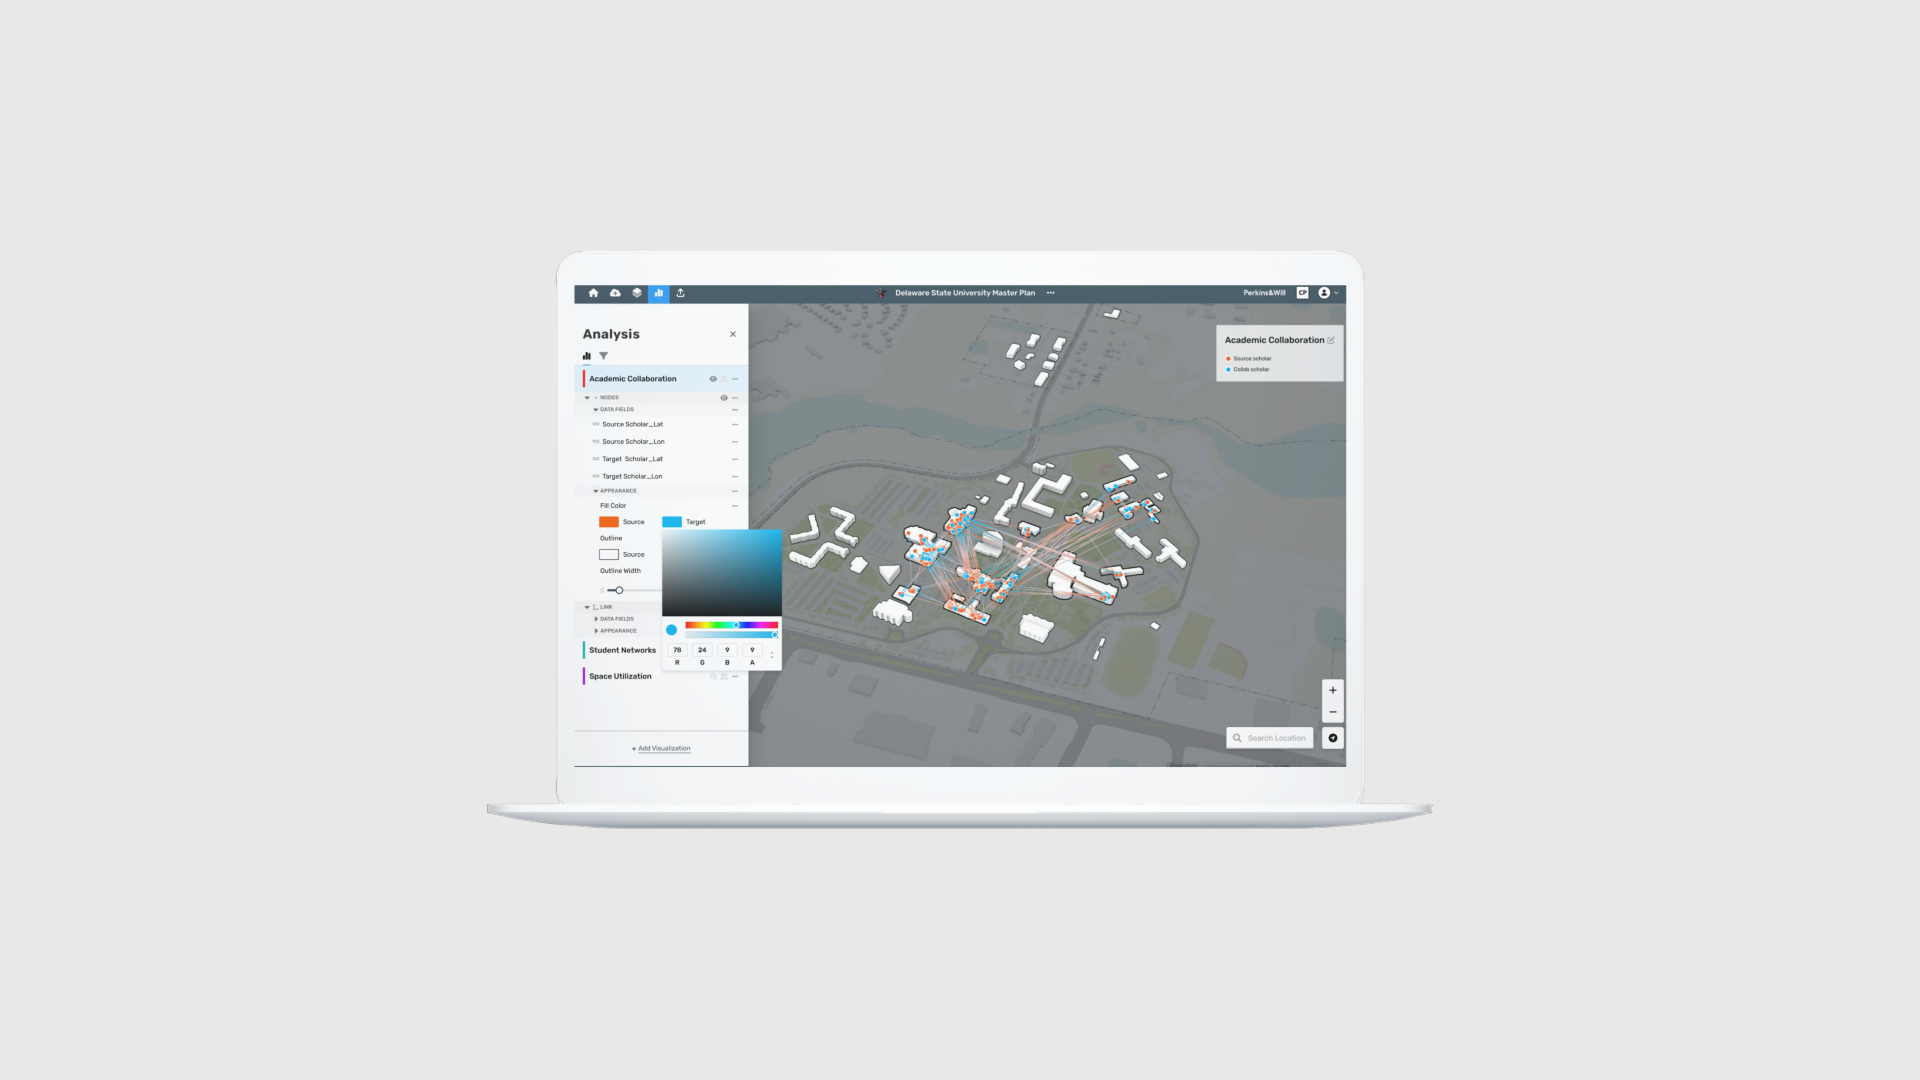
RoleProduct Designer
ScopeWeb mapping • 2D/3D visualization • Data exploration
TeamDigital Innovation Lab, Perkins&Will
Timeline2022-2023
FocusSpatial analytics • Map visualization • Urban systems


Portfolio Explorer was created within i/o Digital Innovation Lab at Perkins&Will, a startup-style innovation studio focused on spatial intelligence, digital experiences, and technology for the built environment.
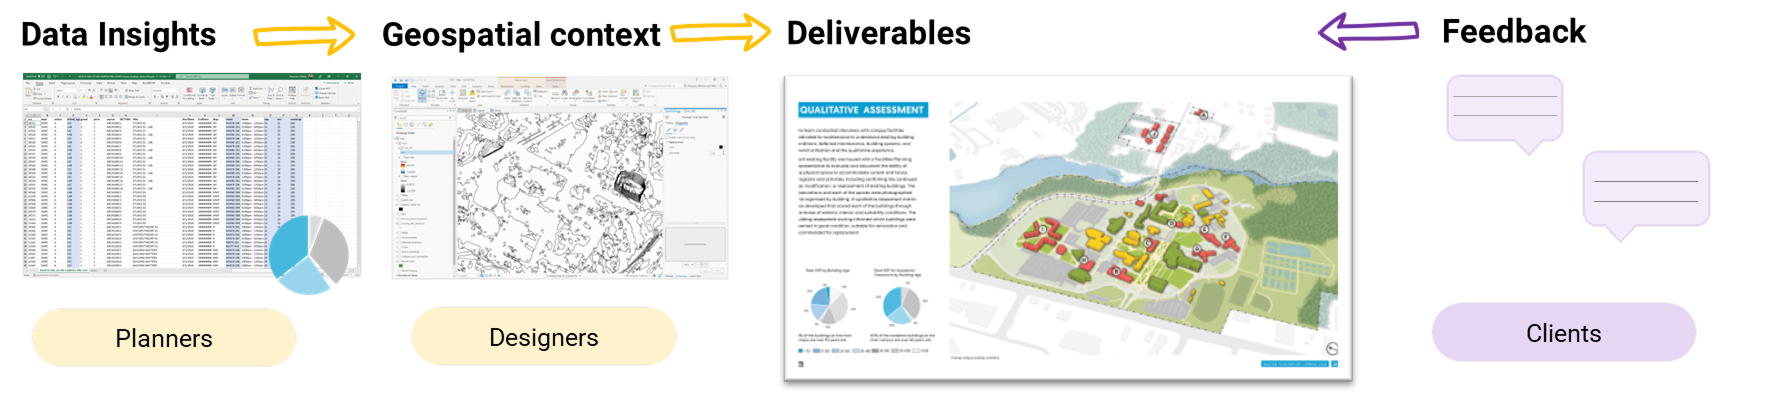
ContextSpatial data was difficult to explore and communicate
Architecture and urban design teams worked with fragmented project data, spatial analysis, and 3D context across separate tools. Insights often had to be manually translated into maps or presentation materials, making collaboration slower and less interactive.
Fragmented data-driven design process
Design ChallengeUsing maps as the interface for decision-making
The challenge was to create a web-based platform that connected data insights directly with geospatial context, so planners, designers, and clients could explore urban scenarios together.
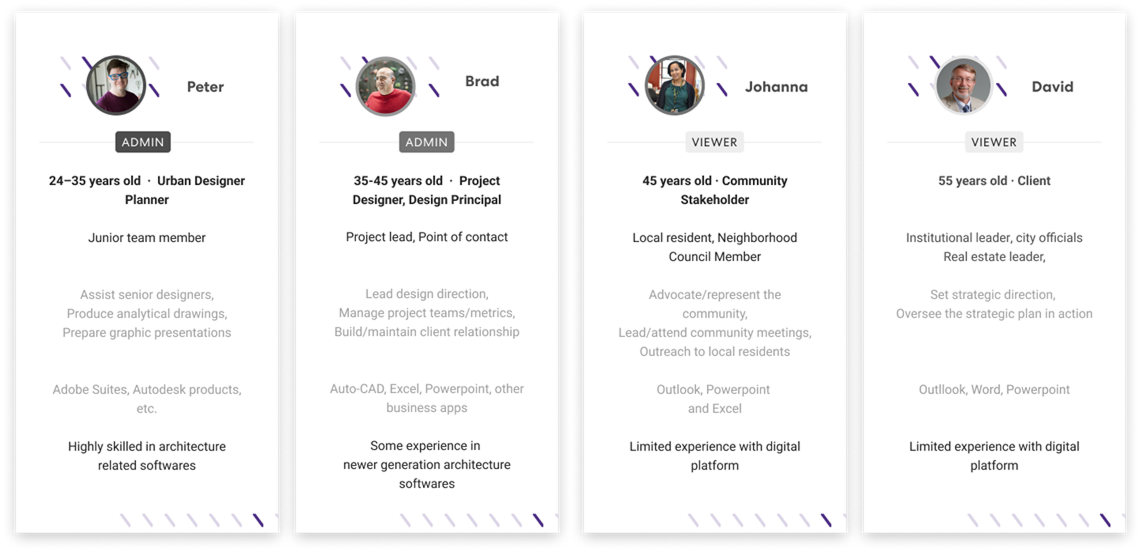
User GroupsSupporting both creators and viewers
The product served two main groups:
Admins — architects, planners, and designers creating spatial analyses.
Viewers — clients, city officials, and residents reviewing projects and giving feedback.
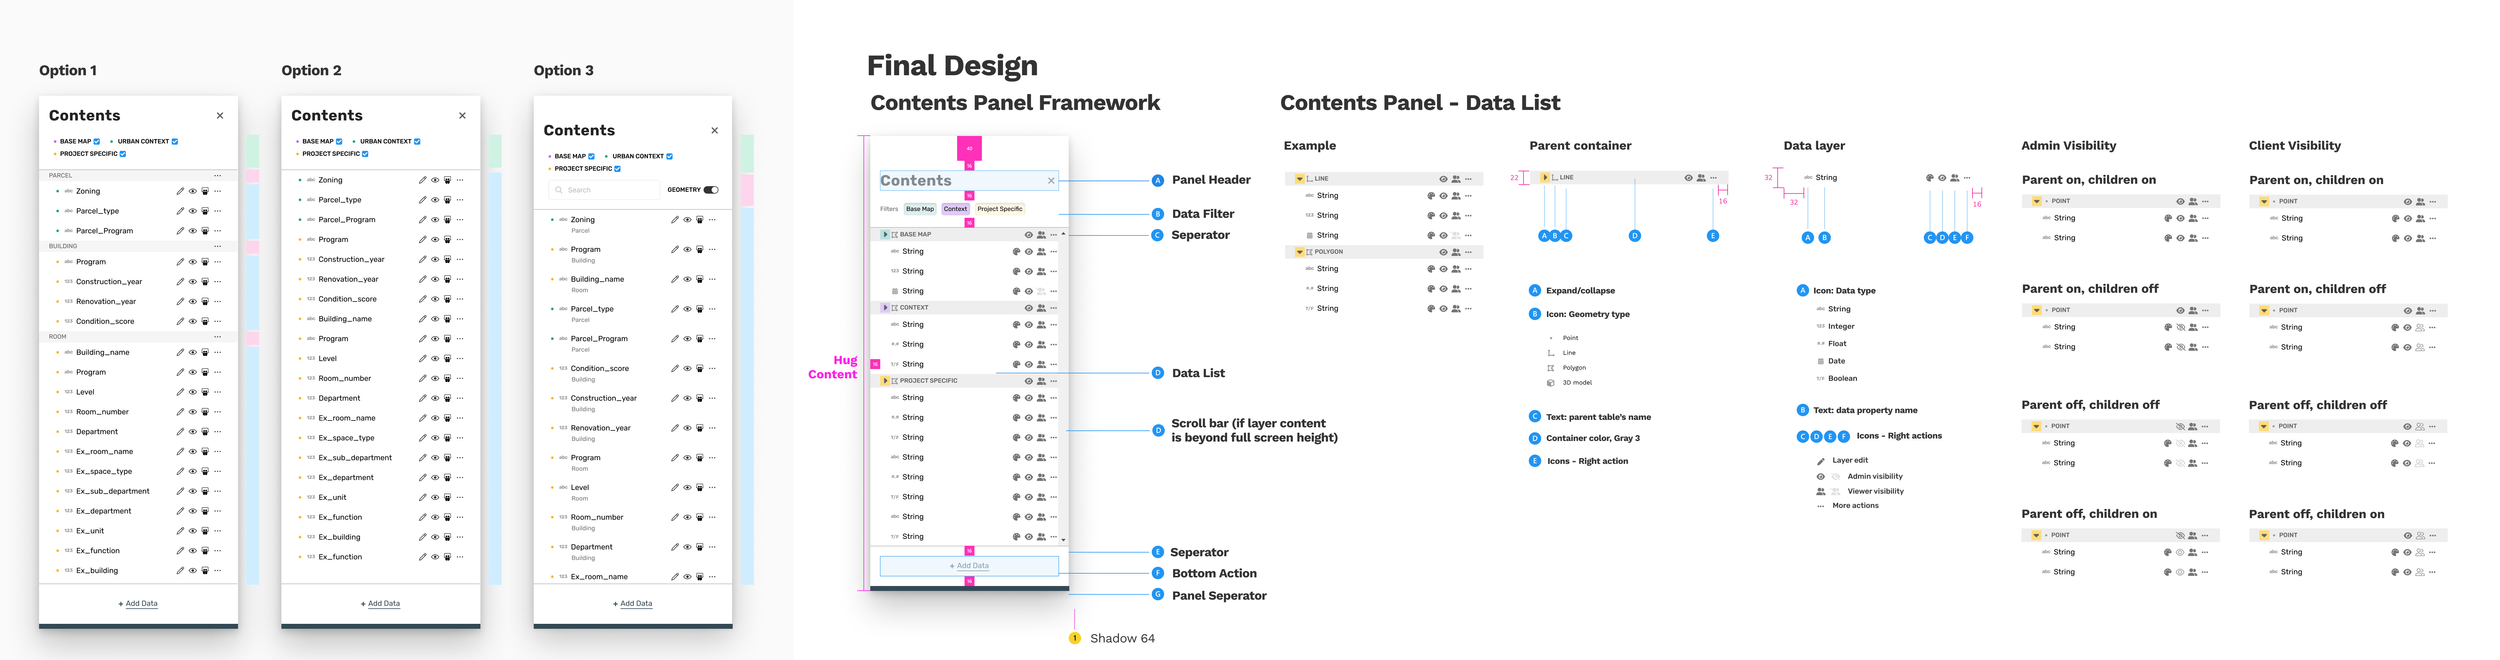
Interaction & Information ArchitectureOrganizing complex spatial layers
Urban projects often involved many buildings, data sources, and visualization layers. I designed panel structures that helped users understand, style, and manipulate spatial layers without requiring advanced GIS expertise.
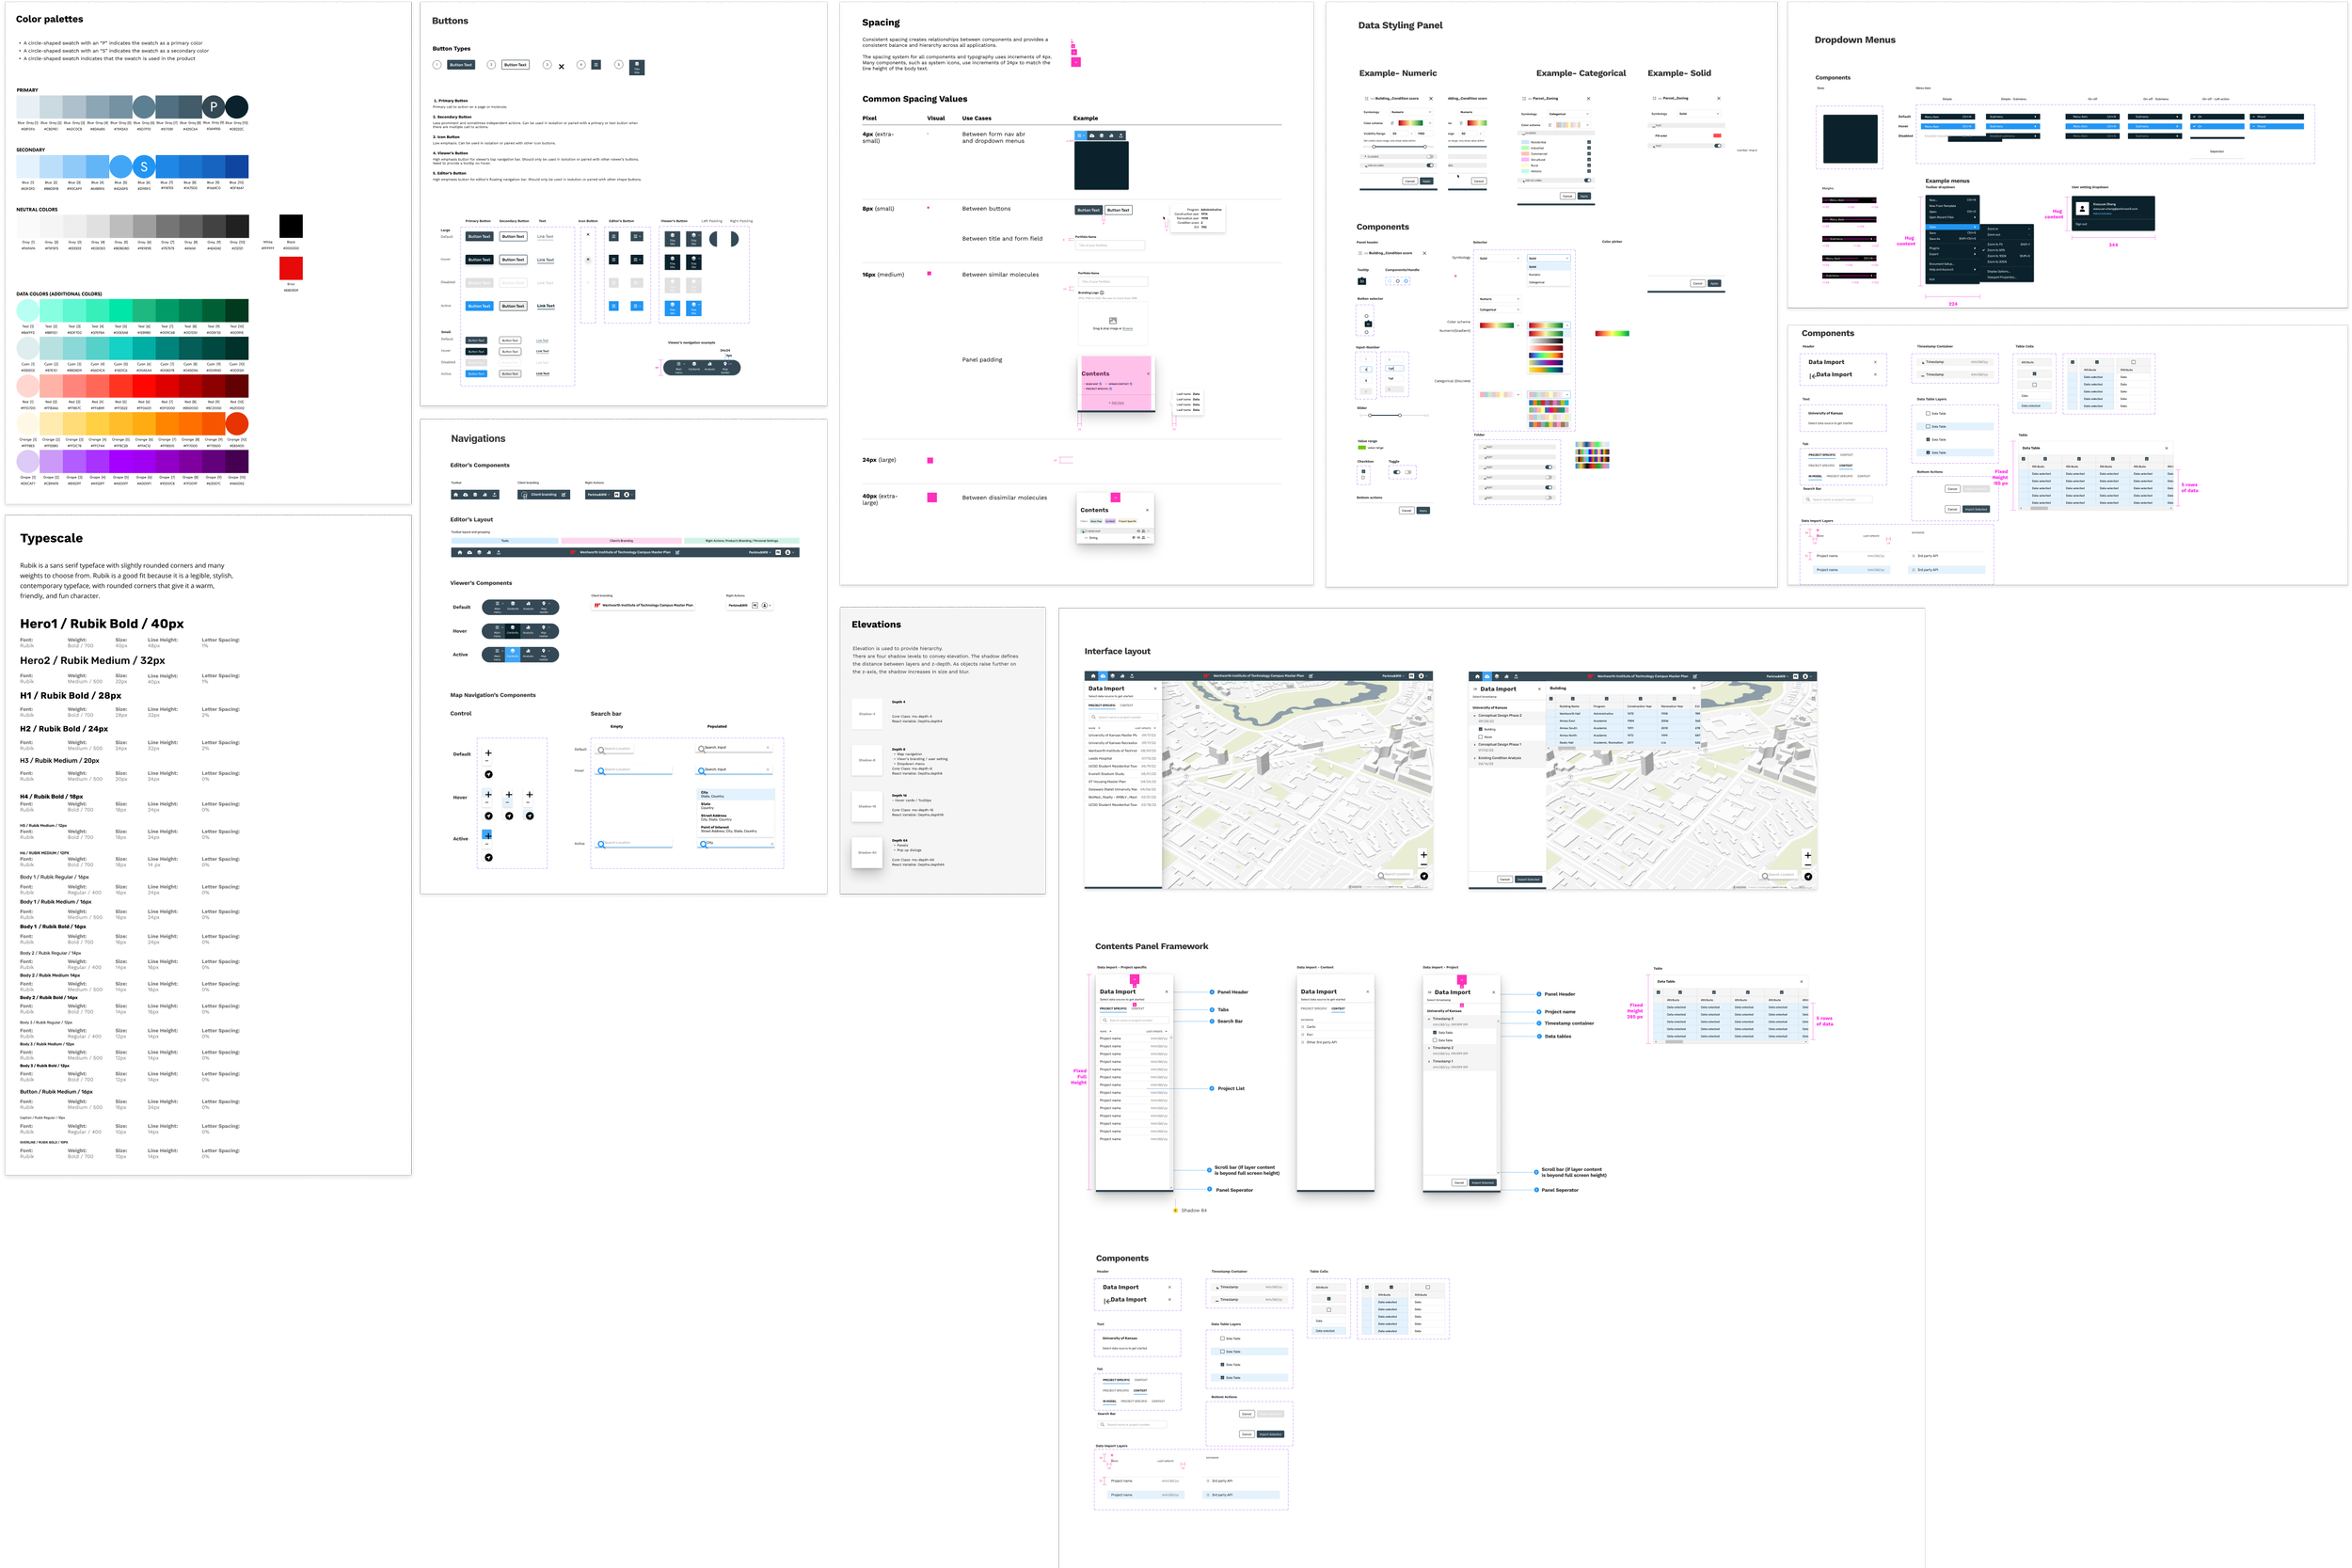
Design System & ComponentsMaking spatial tools scalable
I worked with developers to create a reusable UI component library for geospatial products, adapting Ant Design patterns and documenting component behaviors, edge cases, and design changes.
Key Product FlowsFrom data import to interactive project sharing
Immediate Data Import
Import data directly from the internal project library.
Intuitive Spatial Data Visualization and Analytics
Effortlessly analyze and visualize spatial data.
Seamless Project Sharing
Share projects with clients smoothly and efficiently.
Viewing Experience
Access and interact with the project from any browser for optimal user convenience.
OutcomeInteractive spatial storytelling improved project delivery
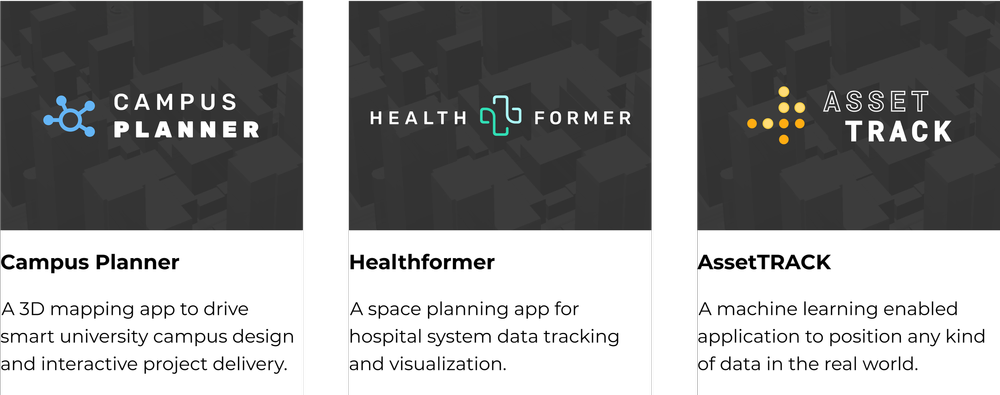
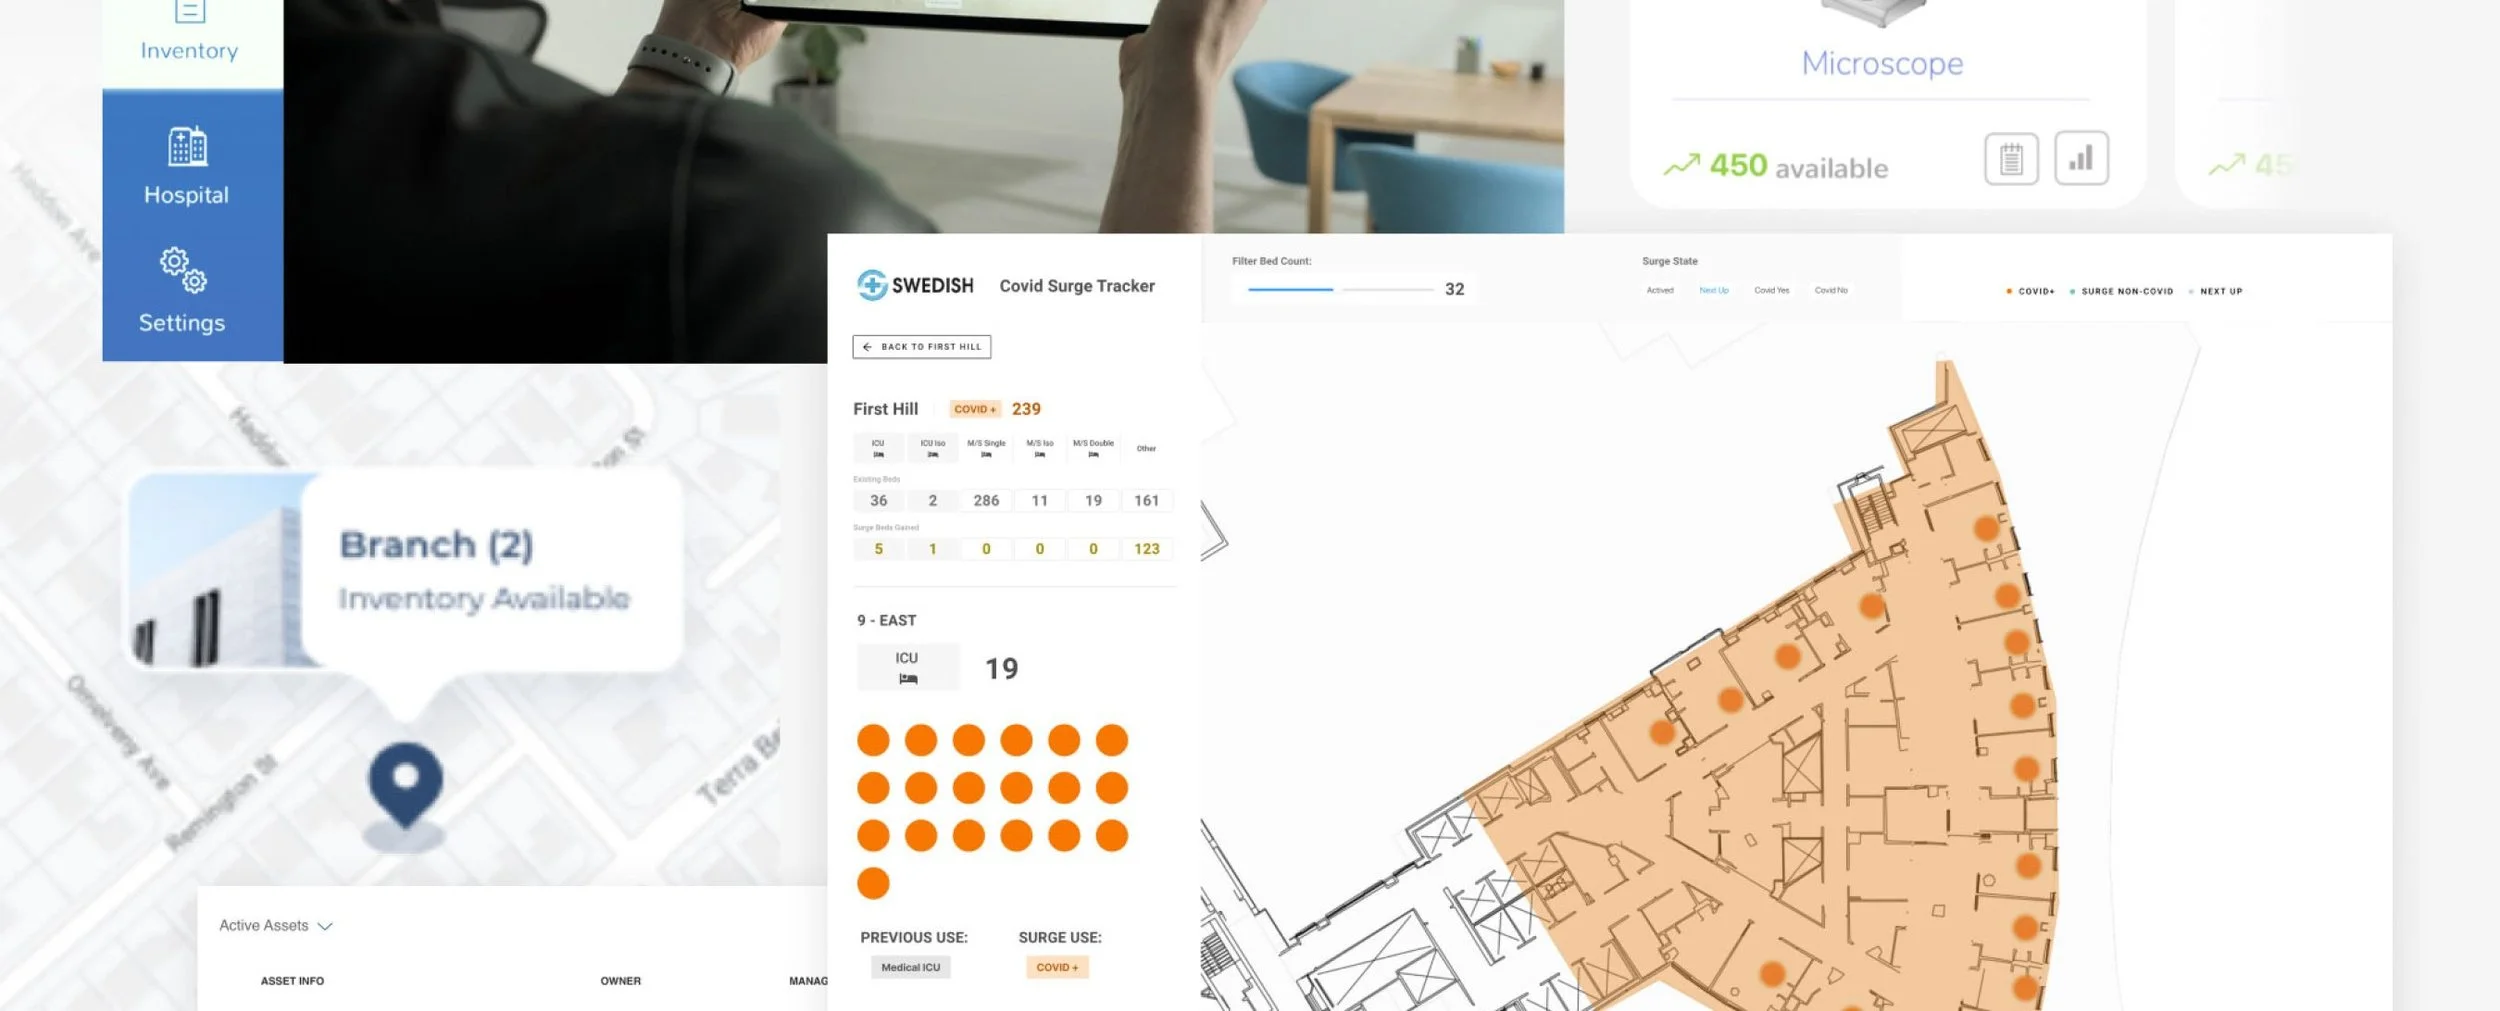
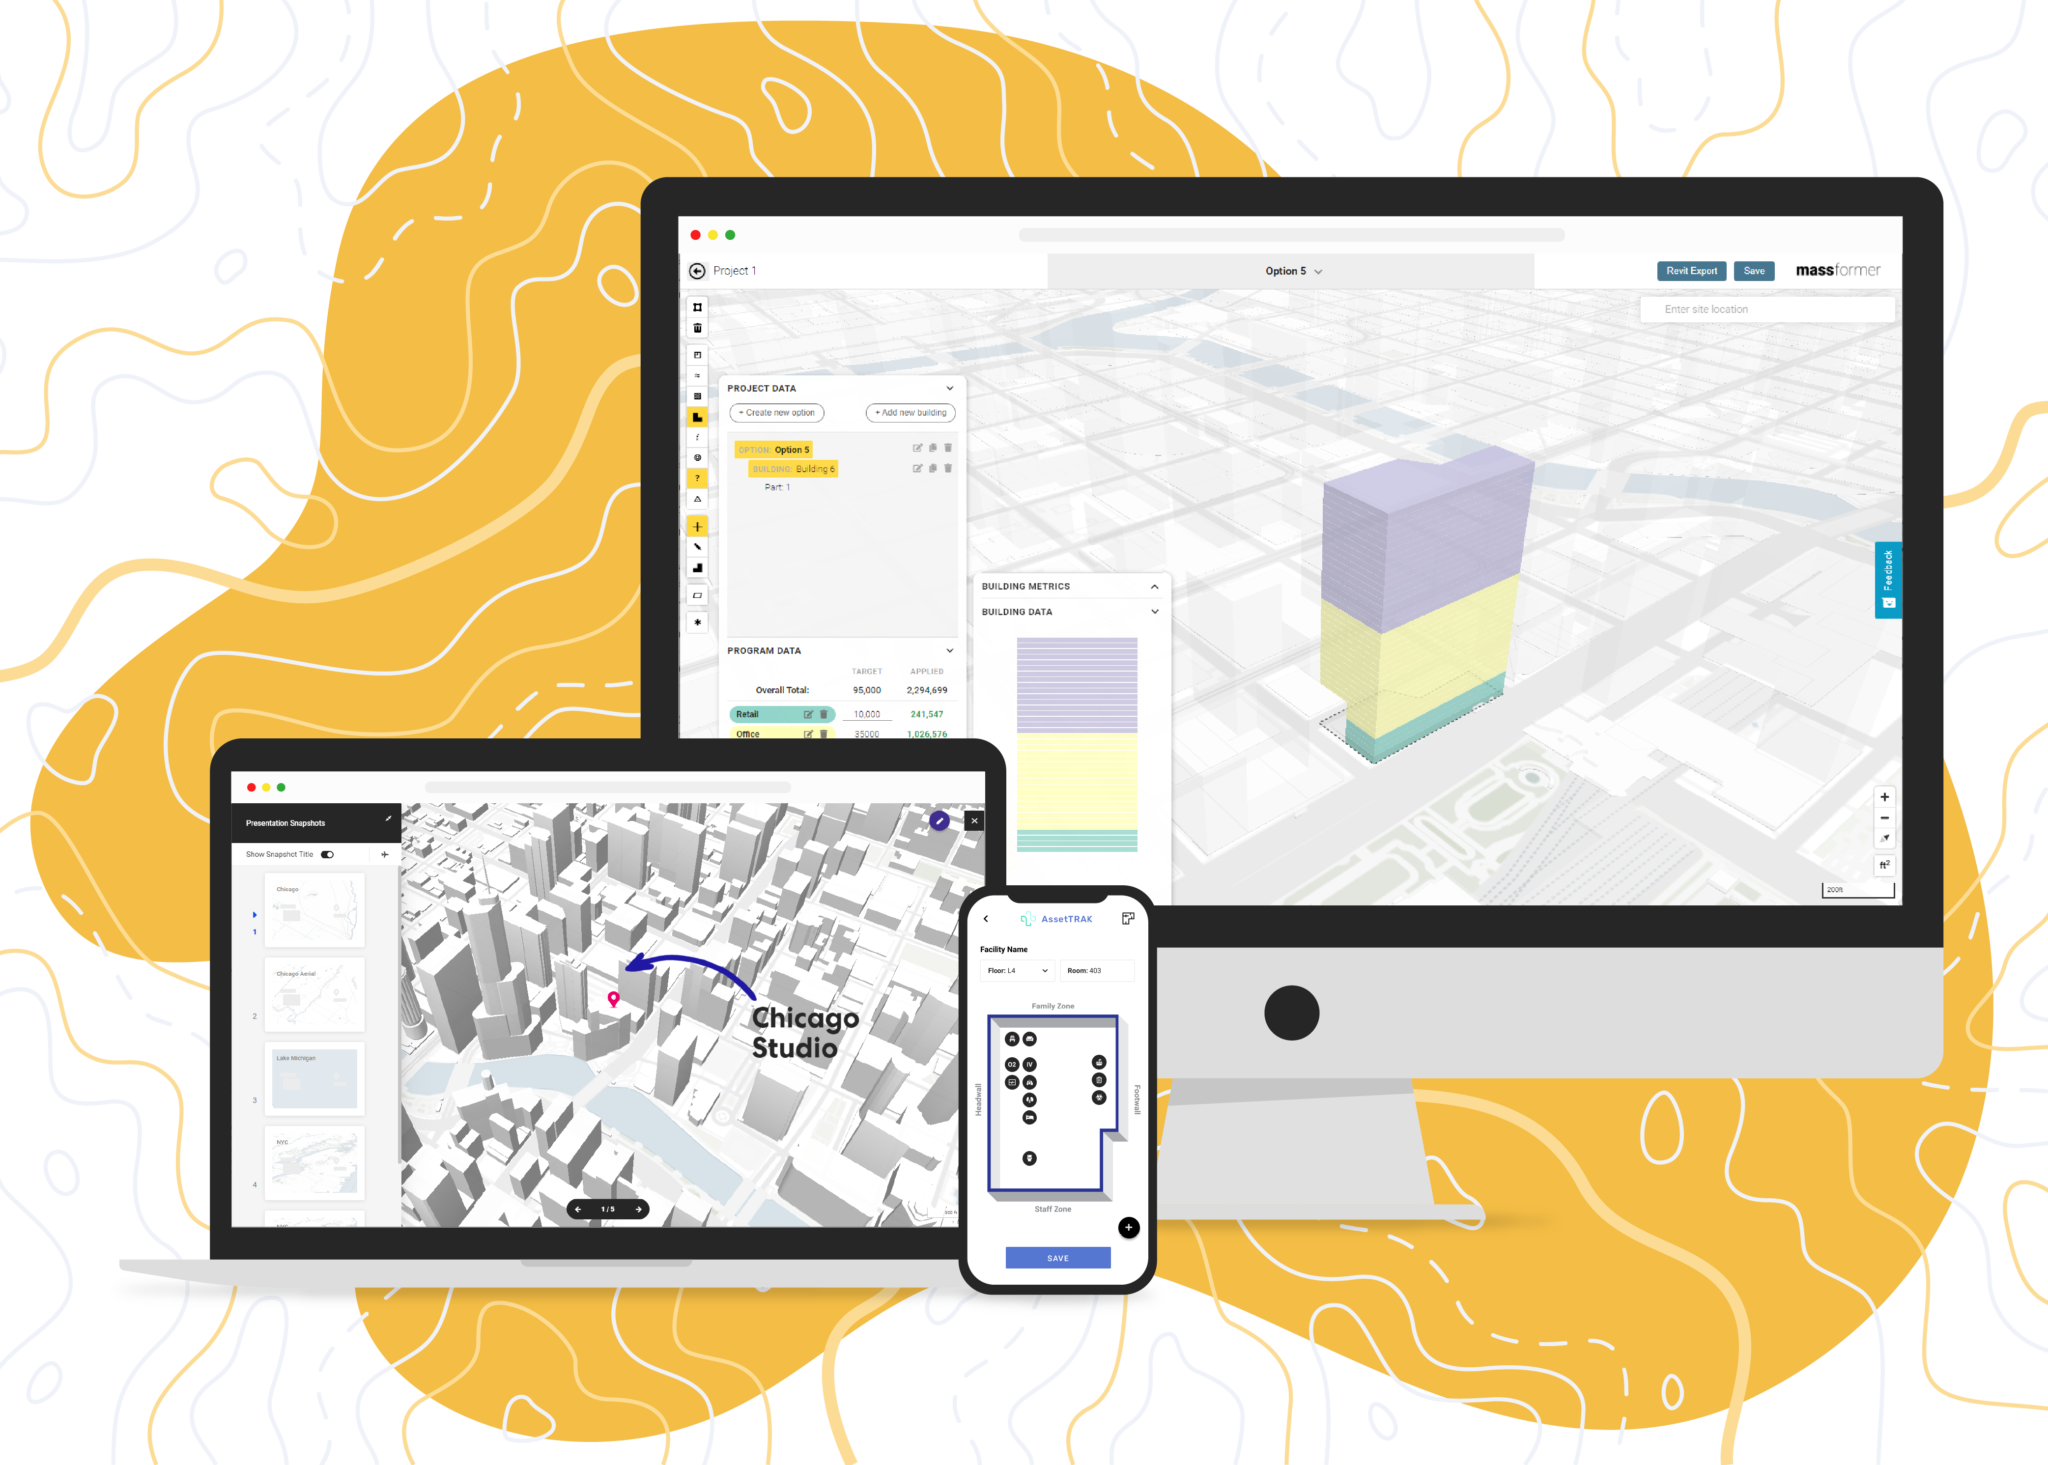
The app helped the Boston urban design team win two projects in four months and contributed to $650K in revenue. It also gained leadership interest for future practice-specific modules, including campus planning, healthcare, and asset management.